Core Web Vitals
analytics
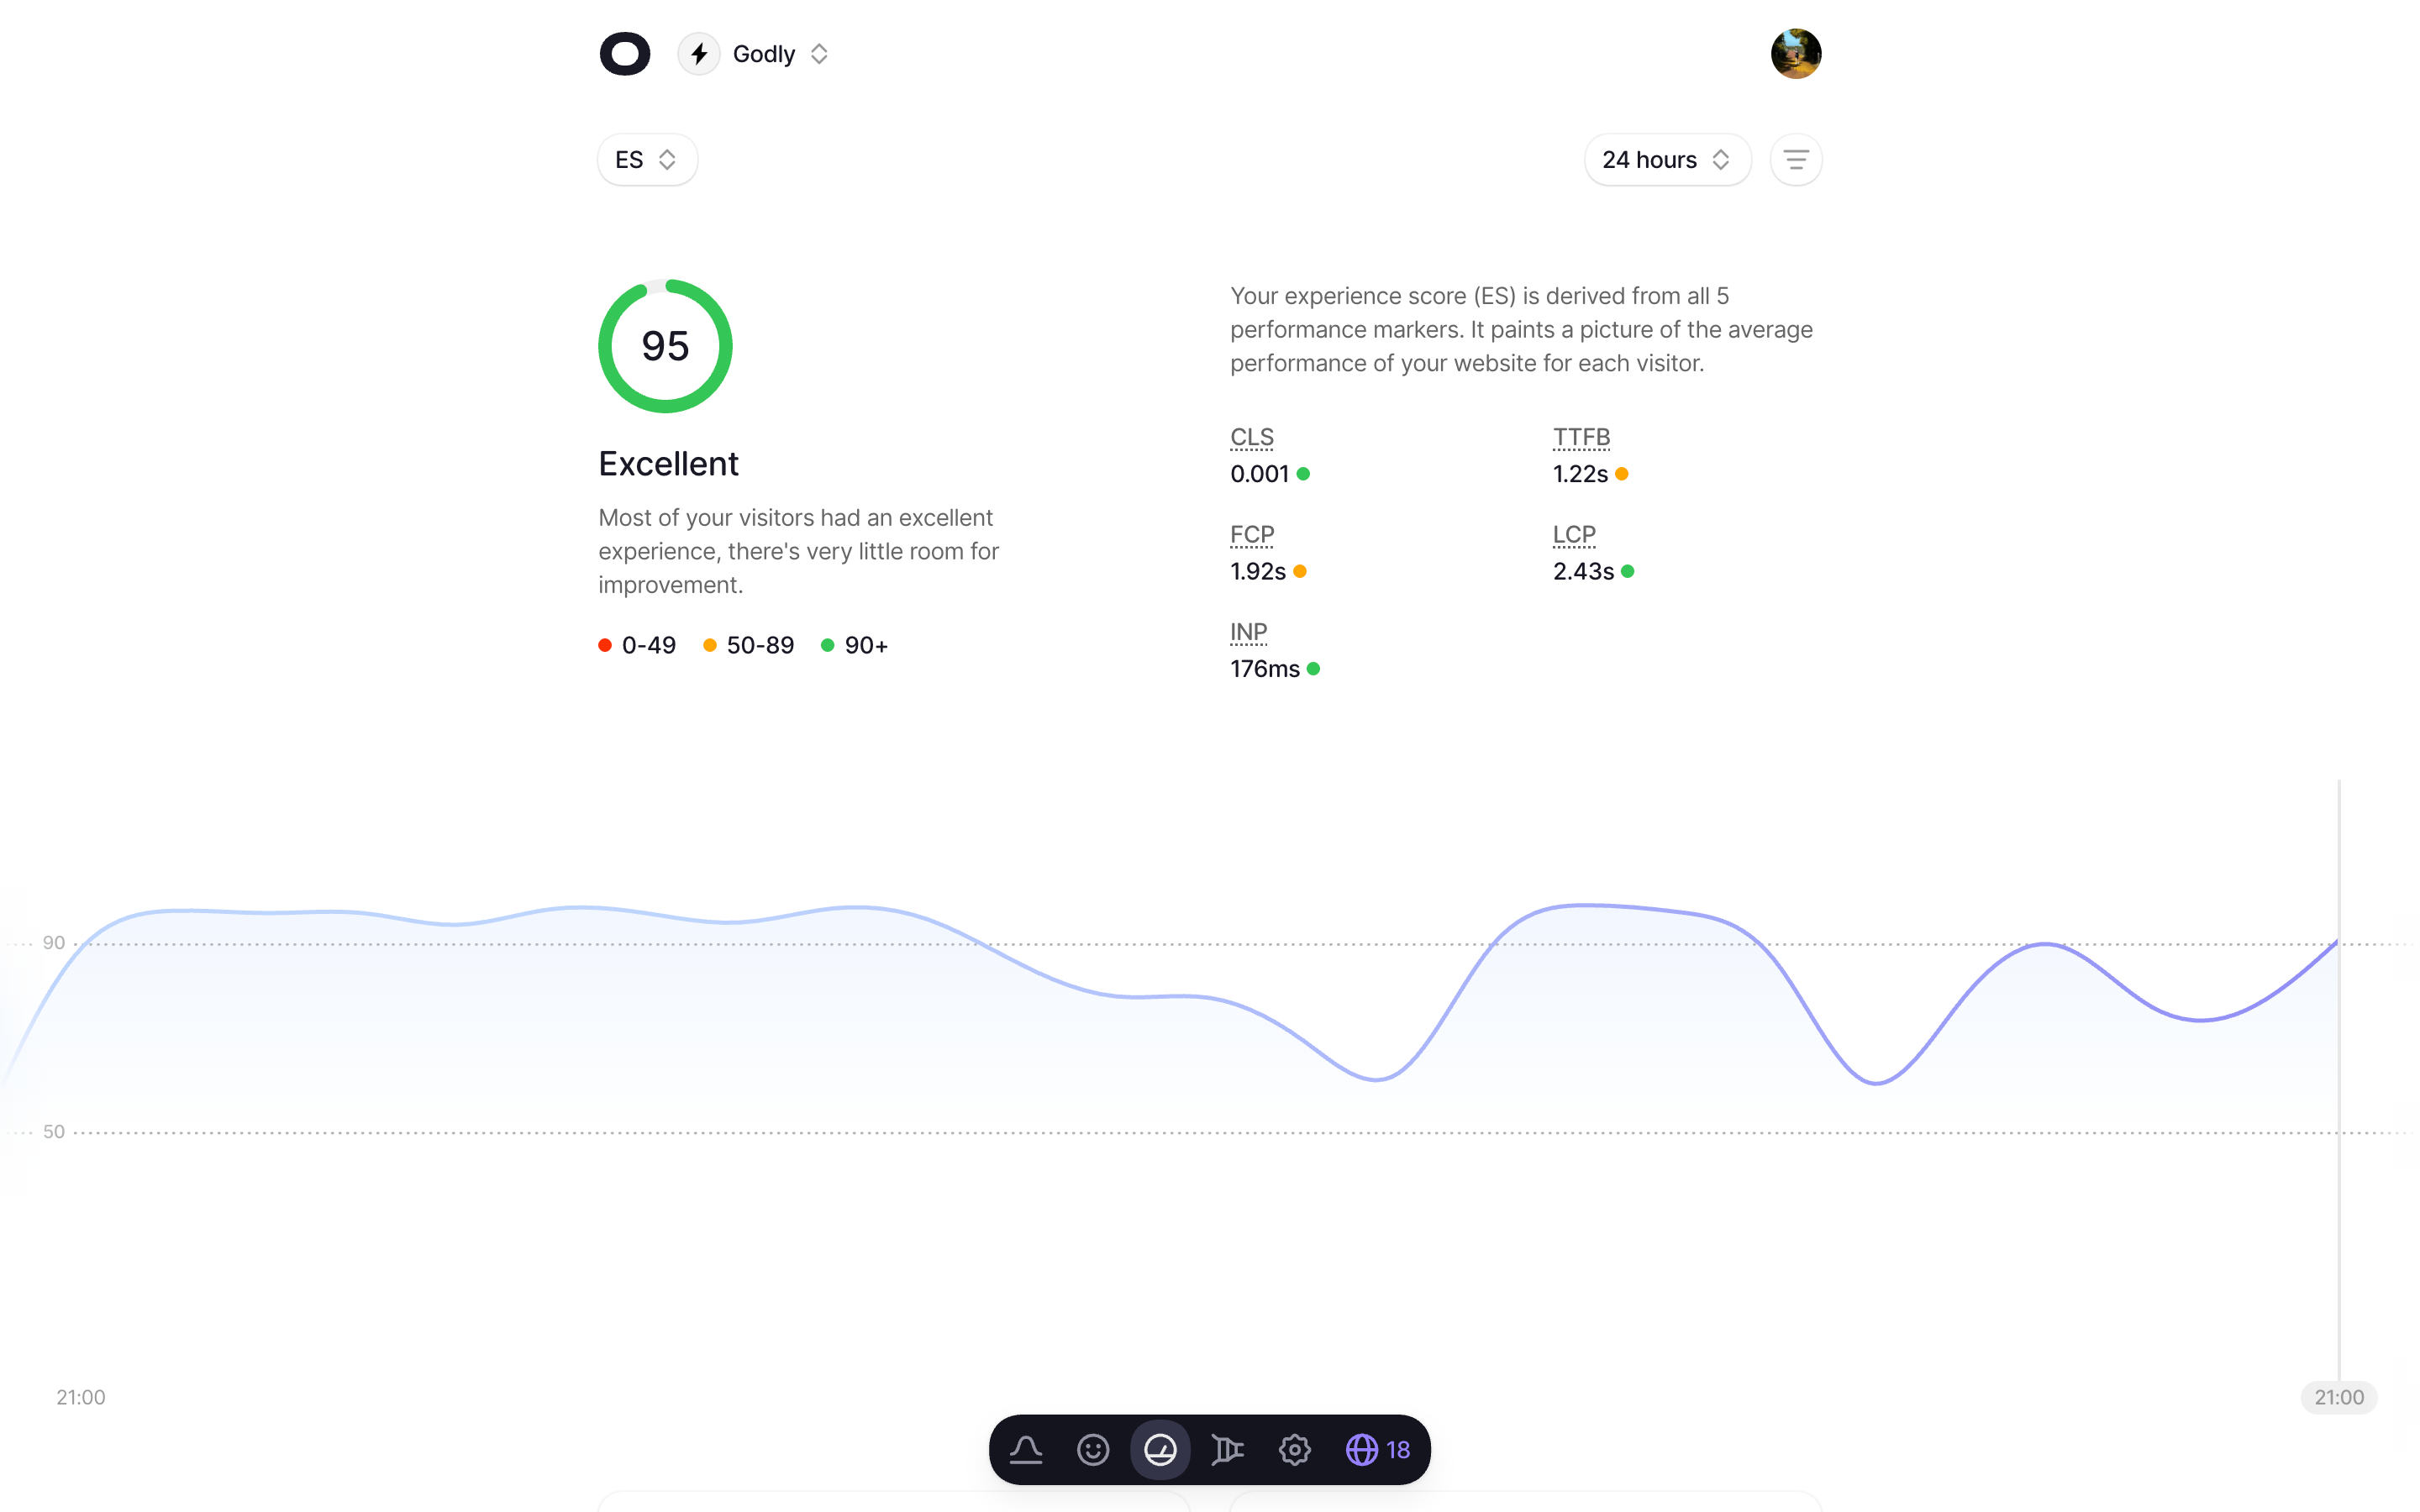
Track real user performance metrics from actual visitors. See LCP, INP, CLS, FCP, and TTFB broken down by page, country, and device.
No sampling. Every single visitor and pageview. No gaps or inconsistencies in your data.
Instant updates. See changes the moment they happen. Not weekly like CrUX.
Experience Score. One number that tells you if your site actually feels fast.
Real user results.
Not Lighthouse simulations.
Lighthouse and PageSpeed run lab tests in controlled environments. We measure what your actual visitors experience.
Experience score
Track your website's experience score and improve it over time.
All your visitors had a perfect experience. That's pretty remarkable.
Best performers
See which pages deliver the best experience for your users.
Pages to improve
Quickly surface pages which are performing poorly.
Global performance
See how your site performs in different areas of the world.
Performance data that actually helps.
You've run Lighthouse a hundred times. Green scores, but users still complain it's slow. That's because lab tests don't see what your visitors see. Different devices, different connections, different results.
Real user monitoring changes that. You'll know exactly where things break down, for who, and on which pages. No more guessing.